Start: Próxima fecha: 27 de enero 2026
DESCRIPTION:
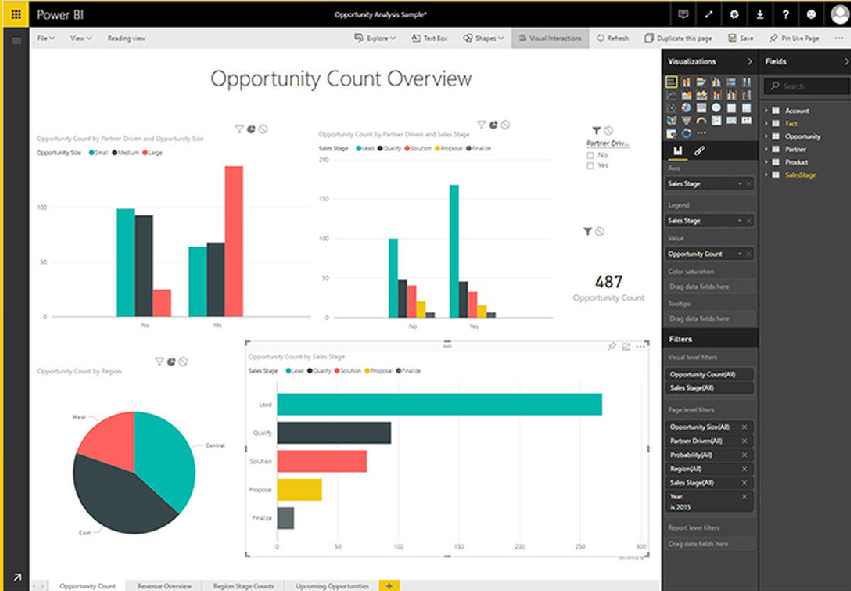
We would use tools for visualization and analysis of a large volume of data called Power BI, leaving aside tools like Excel. It should be noted that these courses are in high demand nationwide, because they allow the student to do data modeling only once and then visualize it automatically and even in “real t”.
ADDRESSED TO:
Engineers in general, specifically business analysts, people who want to learn how to use this software can also participate.
CONTENTS:
• Getting to know PowerBI: Theoretical/practical module that introduces the PowerBI course, tools, licenses, basic concepts of Office 365 and installation.
• Preparing the data and basic visualization elements: Practical module that allows you to know general basic rules for processing data and being able to display them in PowerBI.
• Perform basic calculations in DAX: practical module where we will learn the logic of various PowerBI functions.
• Mix data sources: practical module where we will learn how to load data from the different databases and relate them.
• Dashboards: Theoretical / Practical Module that will basically display the creation of indicators within the different areas of the organization to deploy in the company and establishing the presentation strategy to the company.
• Developing for mobiles: Construction of mobile-based visualizations for data visualization in the company.
REQUIREMENTS:
Basic knowledge in Excel. Laptop to the course with the software installed, keep in mind that Power BI only runs on Windows.
PHIL CROSBY
The success or failure of an organization is due to the effectiveness of the leader; This is more the rule than the exception. The leader is the one who sets the lifestyle for the organization. This occurs both in a direct positive action and in a
ELEARNING
We countwith an online learning system
IMPROVEMENT PROJECT